Maximum Mean Discrepancy#
(in progress)
Biased, squared maximum mean discrepancy#
Proposed by Gretton et al. (2012)
\(MMD_b^2 = \frac{1}{m^2} \sum_{i,j=1}^m k(x_i,x_j)-\frac{2}{mn}\sum_{i,j=1}^{m,n} k(x_i,y_j)+\frac{1}{n^2}\sum_{i,j=1}^n k(y_i,y_j)\)
Kernel choices#
Energy kernel#
Suggested by Feydy et al. (2019), Feydy (2020)
\(k(x,y) = -||x-y||\)
Gaussian kernel#
\(k(x,y) = \exp\left(-\frac{||x-y||^2}{2\sigma^2}\right)\) whereby \(||x-y||^2 = x^\top x - 2xy + y^\top y\)
Example: MMD with energy kernel#
\(MMD_b^2 = \frac{1}{m^2} \sum_{i,j=1}^m \underbrace{-||x_i-x_j||}_{A}-\frac{2}{mn}\sum_{i,j=1}^{m,n} \underbrace{-||x_i-y_j||}_{B}+\frac{1}{n^2}\sum_{i,j=1}^n \underbrace{-||y_i-y_j||}_{C}\) consider \(x, y\) to be column vectors.
Step 1: Compute the euclidean distance#
Step 2: Compute the biased squared maximum mean discrepancy#
\(MMD_b^2 = \frac{1}{m^2} \sum_{i,j=1}^m A -\frac{2}{mn}\sum_{i,j=1}^{m,n} B +\frac{1}{n^2}\sum_{i,j=1}^n C\)
References:#
Feydy, J., Séjourné, T., Vialard, F. X., Amari, S. I., Trouvé, A., & Peyré, G. (2019, April). Interpolating between optimal transport and mmd using sinkhorn divergences. In The 22nd International Conference on Artificial Intelligence and Statistics (pp. 2681-2690). PMLR. PDF
Feydy, J. (2020). Geometric data analysis, beyond convolutions. Applied Mathematics, 3. PhD Thesis. PDF
Gretton, A., Borgwardt, K. M., Rasch, M. J., Schölkopf, B., & Smola, A. (2012). A kernel two-sample test. The Journal of Machine Learning Research, 13(1), 723-773. PDF
Implementation#
import numpy as np
import tensorflow as tf
import tensorflow_probability as tfp
tfd = tfp.distributions

class MMD2:
    def __init__(self, kernel : str = "energy", **kwargs):
        """
        Computes the biased, squared maximum mean discrepancy

        Parameters
        ----------
        kernel : str
            kernel type used for computing the MMD.
            Currently implemented kernels are "gaussian", "energy".
            When using a gaussian kernel an additional 'sigma' argument has to
            be passed.
            The default kernel is "energy".
        **kwargs : any
            additional keyword arguments that might be required by the
            different individual kernels

        Examples
        --------
        >>> el.losses.MMD2(kernel="energy")

        >>> el.losses.MMD2(kernel="gaussian", sigma = 1.)

        """
        self.kernel_name = kernel
        # ensure that all additionally, required arguments are provided for
        # the respective kernel
        if kernel == "gaussian":
            assert "sigma" in list(kwargs.keys()), "You need to pass a 'sigma' argument when using a gaussian kernel in the MMD loss"  # noqa
            self.sigma=kwargs["sigma"]

    def __call__(self, x, y):
        """
        Computes the biased, squared maximum mean discrepancy of two samples

        Parameters
        ----------
        x : tensor of shape (batch, num_samples)
            preprocessed expert-elicited statistics.
            Preprocessing refers to broadcasting expert data to same shape as
            model-simulated data.
        y : tensor of shape (batch, num_samples)
            model-simulated statistics corresponding to expert-elicited
            statistics

        Returns
        -------
        MMD2_mean : float
            Average biased, squared maximum mean discrepancy between expert-
            elicited and model simulated data.

        """
        # treat samples as column vectors
        x = tf.expand_dims(x, -1)
        y = tf.expand_dims(y, -1)

        # Step 1
        # compute dot product between samples
        xx = tf.matmul(x, x, transpose_b=True)
        xy = tf.matmul(x, y, transpose_b=True)
        yy = tf.matmul(y, y, transpose_b=True)

        # compute squared difference
        u_xx = self.diag(xx)[:,:,None] - 2*xx + self.diag(xx)[:,None,:]
        u_xy = self.diag(xx)[:,:,None] - 2*xy + self.diag(yy)[:,None,:]
        u_yy = self.diag(yy)[:,:,None] - 2*yy + self.diag(yy)[:,None,:]

        # apply kernel function to squared difference
        XX = self.kernel(u_xx, self.kernel_name)
        XY = self.kernel(u_xy, self.kernel_name)
        YY = self.kernel(u_yy, self.kernel_name)

        # Step 2
        # compute biased, squared MMD
        MMD2 = tf.reduce_mean(XX, (1,2))
        MMD2 -= 2*tf.reduce_mean(XY, (1,2))
        MMD2 += tf.reduce_mean(YY, (1,2))

        MMD2_mean = tf.reduce_mean(MMD2)

        return MMD2_mean, MMD2, XX, XY, YY

    def clip(self, u: float):
        """
        upper and lower clipping of value `u` to improve numerical stability

        Parameters
        ----------
        u : float
            result of prior computation.

        Returns
        -------
        u_clipped : float
            clipped u value with ``min=1e-8`` and ``max=1e10``.

        """
        u_clipped = tf.clip_by_value(u, clip_value_min=1e-8,
                                     clip_value_max=int(1e10))
        return u_clipped

    def diag(self, xx):
        """
        get diagonale elements of a matrix, whereby the first tensor dimension
        are batches and should not be considered to get diagonale elements.

        Parameters
        ----------
        xx : tensor
            Similarity matrices with batch dimension in axis=0.

        Returns
        -------
        diag : tensor
            diagonale elements of matrices per batch.

        """
        diag = tf.experimental.numpy.diagonal(xx, axis1=1, axis2=2)
        return diag

    def kernel(self, u: float, kernel: str):
        """
        Kernel used in MMD to compute discrepancy between samples.

        Parameters
        ----------
        u : float
            squared distance between samples.
        kernel : str
            name of kernel used for computing discrepancy.

        Returns
        -------
        d : float
            discrepancy between samples.

        """
        if kernel=="energy":
            # clipping for numerical stability reasons
            d=-tf.math.sqrt(self.clip(u))
        if kernel=="gaussian":
            d=tf.exp(-0.5*tf.divide(u, self.sigma))
        return d
Example simulations#
Numeric toy example with one-dimensional samples \(X\sim N(0,0.05)\) and \(Y\sim N(1,0.08)\)#
# instance of MMD2 class
mmd2 = MMD2(kernel="energy")

# initialize batches (B), number of samples (N,M)
B = 40
N,M = (20,50)

# draw for samples from two normals (x,y)
x = tfd.Normal(loc=0, scale=0.05).sample((B,N))
y = tfd.Normal(loc=1, scale=0.08).sample((B,M))

# compute biased, squared mmd for both samples
mmd_avg, mmd_batch, A, B, C = mmd2(x,y)

# print results
print("Biased, squared MMD (avg.):\n", mmd_avg.numpy())
print(" ")
print("Biased, squared MMD (per batch):\n", tf.stack(mmd_batch).numpy())
print(" ")
print("A (shape): ", A.shape, ", A (mean): ", np.round(tf.reduce_mean(A).numpy(), 2))
print("B (shape): ", B.shape, ", B (mean): ", np.round(tf.reduce_mean(B).numpy(), 2))
print("C (shape): ", C.shape, ", C (mean): ", np.round(tf.reduce_mean(C).numpy(), 2))
Biased, squared MMD (avg.):
 1.8592064

Biased, squared MMD (per batch):
 [1.8778989 1.8725448 1.8520763 1.8433806 1.8375555 1.8706871 1.8377426
 1.8460778 1.8356341 1.8626964 1.864194  1.8219937 1.8829894 1.8823482
 1.9019922 1.8328006 1.9002373 1.8837405 1.8773578 1.8063233 1.8772355
 1.818045  1.8549396 1.9211222 1.878836  1.8874218 1.8746109 1.8420508
 1.8514216 1.8765984 1.8030391 1.8502506 1.8581074 1.8660026 1.868265
 1.8145266 1.8823993 1.827515  1.8466772 1.8789287]

A (shape):  (40, 20, 20) , A (mean):  -0.05
B (shape):  (40, 20, 50) , B (mean):  -1.0
C (shape):  (40, 50, 50) , C (mean):  -0.09
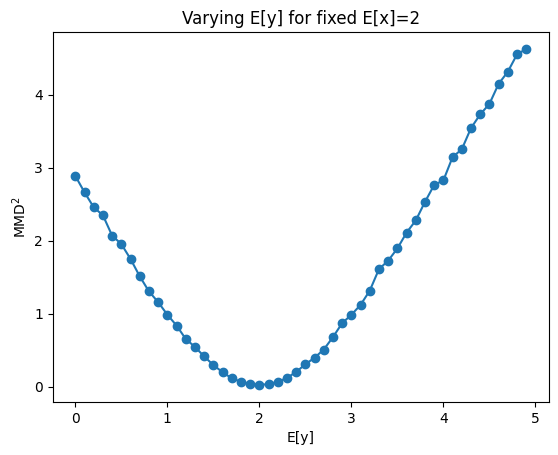
Behavior of \(MMD^2\) for varying differences between \(X\) and \(Y\)#
The loss is zero when X=Y otherwise it increases with stronger dissimilarity between X and Y
import matplotlib.pyplot as plt

mmd=[]
xrange=tf.range(0, 5, 0.1).numpy()
for m in xrange:
    # instance of MMD2 class
    mmd2 = MMD2(kernel="energy")

    # initialize batches (B), number of samples (N,M)
    B = 40
    N,M = (50,50)

    # draw for samples from two normals (x,y)
    x = tfd.Normal(loc=2, scale=0.5).sample((B,N))
    y = tfd.Normal(loc=m, scale=0.5).sample((B,M))

    # compute biased, squared mmd for both samples
    mmd_avg, *_ = mmd2(x,y)
    mmd.append(mmd_avg)

plt.plot(xrange, mmd, "-o")
plt.ylabel(r"$MMD^2$")
plt.xlabel("E[y]")
plt.title("Varying E[y] for fixed E[x]=2")
plt.show()
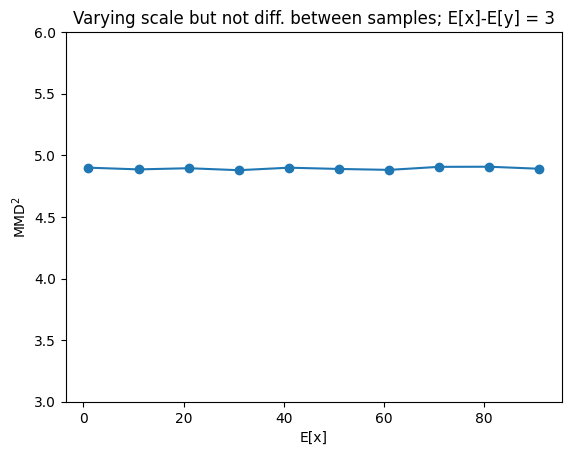
Behavior of \(MMD^2\) for varying scale but same difference between X and Y#
Changes in scale do not affect the loss value
mmd=[]
xrange=tf.range(1.,100., 10).numpy()
for x_m in xrange:
    # instance of MMD2 class
    mmd2 = MMD2(kernel="energy")

    # initialize batches (B), number of samples (N,M)
    B = 400
    N,M = (50,50)
    diff = 3.

    # draw for samples from two normals (x,y)
    x = tfd.Normal(loc=x_m, scale=0.5).sample((B,N))
    y = tfd.Normal(loc=float(x_m-diff), scale=0.5).sample((B,M))

    # compute biased, squared mmd for both samples
    mmd_avg, *_ = mmd2(x,y)
    mmd.append(mmd_avg)

plt.plot(xrange, mmd, "-o")
plt.ylabel(r"$MMD^2$")
plt.xlabel("E[x]")
plt.title("Varying scale but not diff. between samples; E[x]-E[y] = 3")
plt.ylim(3,6)
plt.show()